
Now that we have understood the components of TVM (Click HERE to learn about the components of TVM), when dealing with some financial problems, it is best to describe via some series of a diagram, where it will help you to visualize the problem and shows all inflows and outflows of cash along a timeline.
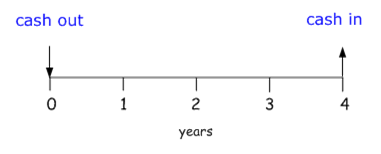
Hence, a cash flow diagram allows you to graphically illustrate the timing of the cash (be it inflows of cash or outflows of cash). A cash flow diagram had a horizontal timeline subdivided into equal periods such as days, months or years. For each cash flow say some payment or receipt, will be plotted along this line at which it occurs whether at the beginning or at the end of the period. There can be positive cash flow where each is represented by arrows which extend upward or downward from the timeline with their bases at the proper positions along the timeline.
It is important to understand that funds that you receive, such as proceeds from a mortgage or withdrawals from a saving account are positive cash flows represented by arrows extending upward from the timeline with their bases at the appropriate positions along the timeline. While funds that you pay out such as savings deposits or lease payments are negative cash flows that are represented by arrows which extend downward from the line. One helpful way to think about is a negative sign simply means money is flowing out of your pocket. A positive sign means money is flowing into your pocket.
In short, if you have X (PV) amount in your savings account, that amount of money that you have now is a negative cash outflow where you will treat it as though you were just now depositing it into the account. It might seem confusing with the pointing or arrows, but as long as you understand what they represent, really it doesn’t matter how you draw your arrows.
We know that there are always two sides to a financial problem: a borrower and a lender; a buyer and a seller; an investor and an investment. You should keep in mind the dual nature of financial problems when drawing a cash flow diagram. From whose perspective will it be drawn? The example of a simple loan is shown below. From the borrower’s perspective, the transaction consists of a large cash inflow followed by a series of smaller cash outflows. While that situation is exactly reversed for the lender:
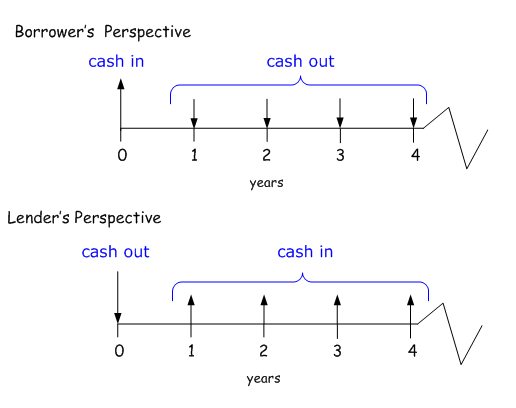
Note that the amounts calculated (PV or FV, payment amount, interest rate, the number of periods) will be the same regardless of the perspective from which the cash flow diagram is drawn. It simply helps in understanding and describing the problem to be conscious of the perspective from which it is viewed. Hence, cash flow diagram’s purpose of depicting a complex financial problem as concisely and precisely as possible.
Continue to TVM in Mathematical Interpretation HERE.