Inflation is a poorly understood phenomenon. It had been around for as long as goods and services have been traded.
“Inflation is when you pay fifteen dollars for the ten-dollar haircut you used to get for five dollars when you had hair.” – Sam Eving
Do you know that $1 in 1970 is worth $6.5 in today’s dollar?
In 1970, your one dollar could exchange 4 loaves of bread, in today 2020, Bread in the US is roughly $2.50 per loaf, that one dollar can only exchange for about two-fifth of a loaf of bread.
Everyone had heard stories from parents and grandparents about how much more gas or milk is costing than when they were children. Things were cheaper “back then,” because inflation has lowered the currency’s value over the years. That means a currency’s purchasing power has gone down; the money just doesn’t buy as much as it used to.
Measuring Your Purchasing Power
So, what you can do to protect your wealth in times of inflation or reducing purchasing power? You need to start building a portfolio that is “inflation-proof” that not only appreciate in value but more importantly able to provide safety from inflation over time.
There are four major investment categories, and these are known as asset classes. These categories include cash, fixed interest, real estate, and equities and precious metals. Do you know that cash yields the lowest return? Yes, it does, it is the safest asset class, perhaps. Having money for liquidity is good, but its risk is that it won’t keep up with inflation.
To give you some perspective, we will show you the different scenario of how different asset class (cash, precious metals, and Stocks) perform in relation the consumer price index or the purchasing power of the consumer dollar since 1971 (The Bureau of Labor Statistics defines the U.S. CPI as “a measure of the average change over time in the prices paid for a market basket of consumer goods and services by urban consumers.”)
Cash (Dollar) in Actual Buying Power
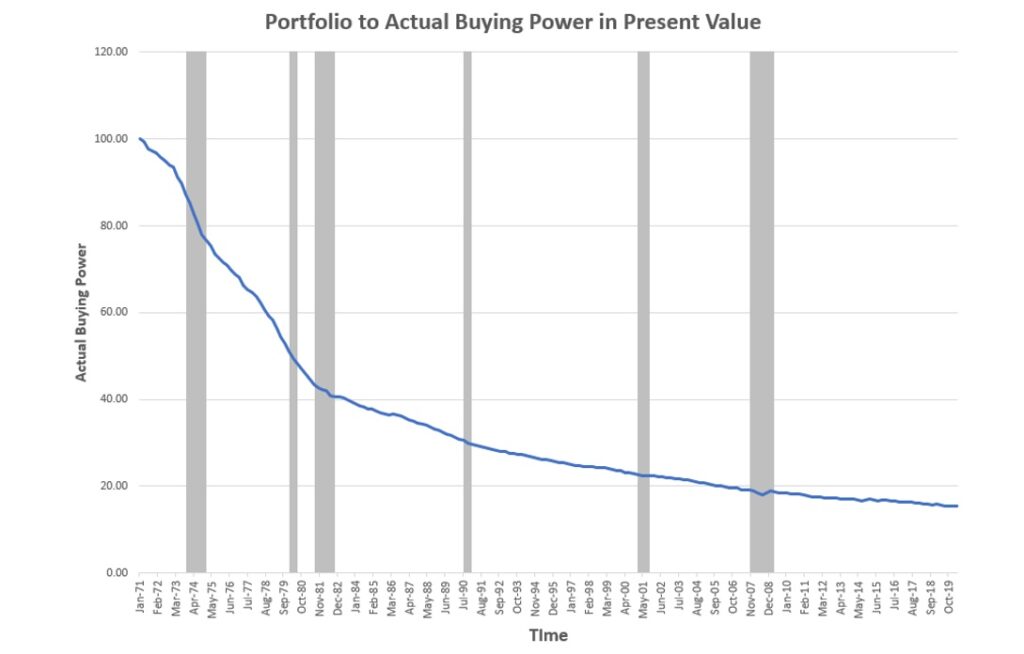
The above graph shows that if you keep $100 dollar cash in a safebox in 1971 and takes it out to spend in April 2020. The actual buying power of this $100 dollar bill is only worth $15.5 of goods and services back when in 1971.
Precious Metal (Gold) in Actual Buying Power
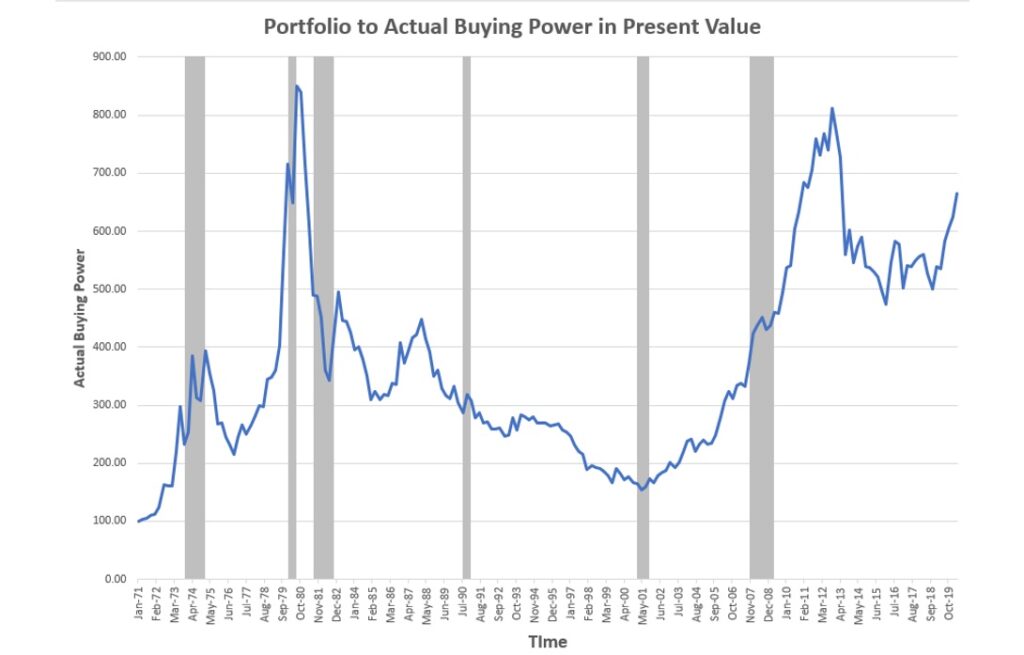
The above graph shows that if you invest the same $100 dollar cash into physical gold in 1971 and sell it in April 2020. The amount in terms of the dollar would appreciate 4200%, whereas the buying power would have multiply 5 times! (5 x worth of goods and services back when during 1971)
Stocks (S&P 500) in Actual Buying Power
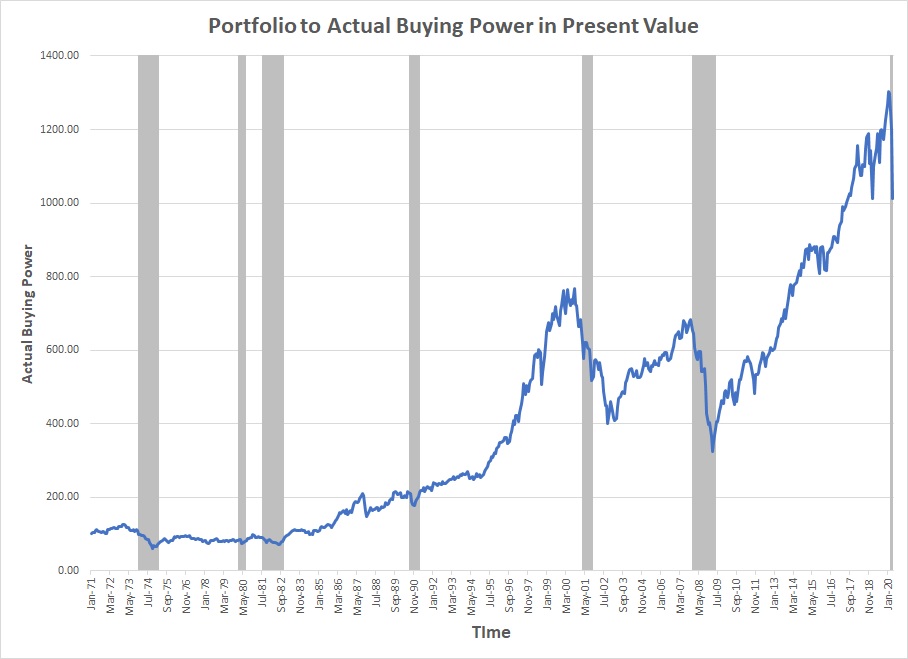
The above graph shows that if you invest the $100 dollar cash into the S&P500 index in 1971 and sell it in April 2020. The amount in terms of the dollar would appreciate 6500%, whereas the buying power would have multiply 10 times! (10 x worth of goods and services back when during 1971)
Contrary to popular belief that the stock market always outperformed precious metal investment. This is not always the case as you can see in the above examples. Also, note how the asset classes performed during a market downturn (Shaded areas showed past recession). For example, $60 in 2000 is now worth almost $39.8 in 2020. This shows that the purchasing power of the USD has fallen by almost $20. This corresponds to a fall in the value of almost 33.3%, whereas in the same period the value of an ounce of gold has risen from approximately $300 to almost $1750, corresponding to an increase of almost over 400%.
So if someone invested in gold and forex simultaneously at the beginning of the millennium, then their forex investments went through depreciation of almost 33.3% in the last two decades whereas their gold investment went through almost 400% appreciation in the same time. And of course, there is another important factor not to be denied if you invest in the stock market instead, is that some companies payout dividends to the stock owner.
Making Cents of Your Money
Given that cash generally loses its value over time, therefore, investing with your money is far better than saving your money. Hence, it is essential to broaden your investment network, just like you have, or planning to diversify your profits. If you have almost all your money invested in the stock market, you may end up losing all, if an economic downturn hit, which could lead to a financial disaster. Go through your investment portfolio and ensure your investments are expanded across diverse industries and even various asset types in your portfolio.
Then, what is the perfect investment portfolio?
Generally, the ideal asset allocation is the mix of investments, one should seek a balanced portfolio which is a mixture of those assets in a ratio of around 50% growth and 50% profits. It is a portfolio for those who are risk-averse but need an increase in their investments.
“The biggest risk is not taking any risk. In a world that’s changing really quickly, the only strategy that is guaranteed to fail is not taking risks.” – Mark Zuckerberg
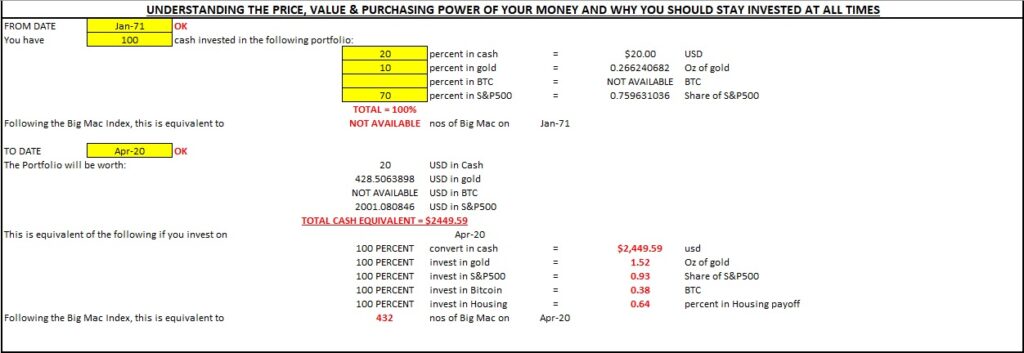
Here’s a tool you can experiment by inputting different percentages and mixture in each asset class and observe how the portfolio performed in terms of inflation and purchasing power. By combining these assets, your return is the average of the highs and lows that smooth out the market’s volatility.
Click below image to download
It is a harsh truth to learn, millennials face a harder life than their parents did — as they are confronted with different financial struggles, wages that don’t keep up with inflation, and increasing expenses of cost of living. However, in reading this article, you are already ahead of 99% of the population and I believe you will start planning about your finances.
If you are looking for early retirement or financial independence then you can’t afford to wait any longer. You must act today, get out of debts, start investing, exercising prudent action now to safeguard your future finances. Good Luck!
If you’d like to learn more financial and investing concepts, and how to apply them to your investing needs, and how to become an invested millennial. Follow us on Amazon and get our best-seller books now.
Continue reading: Finding Your Financial Independence Ratio

