
In this article, I will show you 3 simple illustrations of investments spanning across different periods, I would like to show you some investment opportunities you may be missing.
Graph #1: (January 1981 – January 2001)
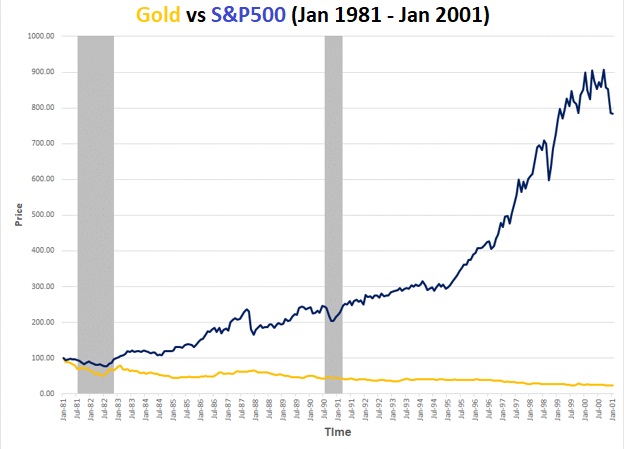
When economists said that gold is one of the worst investments, they were right. If you were to invest $100 into S&P 500 (with reinvested dividend), your rate of return, adjusted for inflation, would have been 800%, and would result in loss of purchasing power had you invested in gold.
Graph #2: (January 2001 – January 2011)
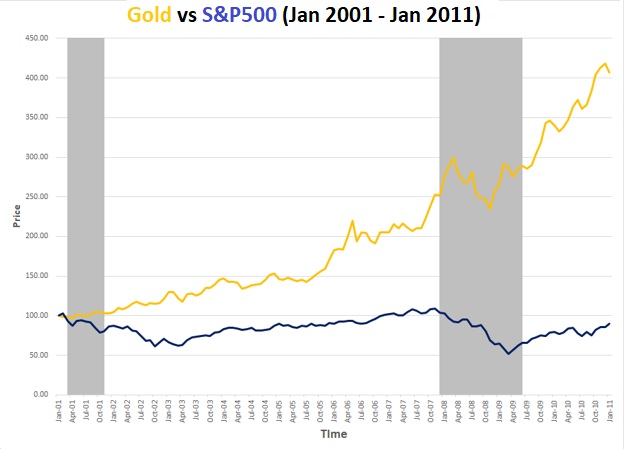
Investing in gold, according to this period graph would have increased your $100 investment by 400%. Had that investment been made into S&P 500 (with reinvested dividend), purchasing power would have been lost. In this case, the claims that gold outperformed S&P 500 would be accurate.
Data Tells The Truth, But Not The Whole Truth
The missing element in what has been pointed out thus far is the concept of an “economic wealth cycle.” The economy expands and contracts in a sort of a pattern over time. What this means is that certain asset classes will be either undervalued or overvalued, depending on where in the economic growth cycle we find ourselves.
So where is this cycle now?
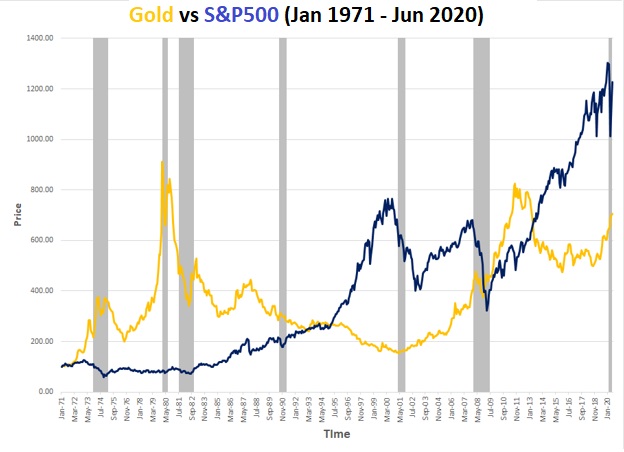
Graph #3: (January 1971 – to June 2020)
So what is it that you are missing as far investment opportunities? Time in an economic growth cycle is key for long-term investment. Many of us get swayed easily by the current state of the economy. We tend to believe what the mainstream wants us to, and we come into an investment with a short-sighted goal of gains.
Wealthy investors understand this concept and for that reason adopt the cyclical investment strategy. They invest money into the economic sectors/asset classes during specifically selected economic growth cycle stages.
If you are wondering about how they determine these stages, check out this great explanation video from Mike Maloney about value and pricing. As he explains, in the 70s, the price of gold was booming (as noted on chart #3 above) and stocks were rising in price slowly. If one had invested in gold at the time, such an investment could yield enough gains to purchase many stock shares. However, over time, one asset becomes overvalued (gold) and the other undervalued (stocks, so the cycles reverse.
From 1980 to 2000, the stock market surged while gold values went down and plateaued. The two decades rounding out the 20th century were some of the best in terms of stock growth. Currently, we are in the midst of the next cycle, but neither stocks nor gold is going down in value much as more currency is being printed.
An investor who keeps asset classes for an overly extensive amount of time, circles back around to essentially the same worth, but those who recognize the reversing economic trends and can predict when something is undervalued or overvalued, are the same investors who know when to buy certain stocks or invest in precious metals, and to pull back when the economic cycle begins to downturn, investing in the alternative instead.
So, what will you do next?
What is shown right now is only the comparison of Gold and S&P500, how about other asset classes such as bonds, silver, or housing? Then you need to check out the new book on Amazon – Making Sense of Your Money, which provides you the tool to access the inflation-adjusted return for other asset classes.