
One approach by investors is that they will do analysis by looking at a company fundamental: its balance sheet, income statement, cash flow, and the company’s industry and etc. They would focus on dividends and cash flows of a company and trying to find the intrinsic value of a company. The process of such approach is often time-consuming and difficult to understand. The valuation includes dividend discount model and discounted cash flow model for income and growth stocks. We will cover this in time to come.
But for now we will focus on another approach of valuation, where investors use ratio-based approach to justify stock prices. Most of these ratios can be calculated as most data are readily available, making it a lot easier and faster compare to intrinsic approach. The common types of such valuation method include Return on Equity, Price to Book ratio, Price to Earnings ratio, and PE to growth ratio. Before getting to calculate these ratios, an investor needs to understand a few of the terms such as the Book value, Earnings per share (EPS).
Book Value
Book Value which also known as a company’s Net Asset, shareholder’s equity, or simply Total Assets minus Liabilities. It is the term which means the value of the firm as per the books of the company. It is the value at which the assets are valued on the balance sheet of the company as of the given date.
Book value is often used by investors as a per share value, where the book value is divided by the number of shares outstanding at the date of the balance sheet. Book value per share would show the comprehensive earnings or losses of a company. Book value also reflects when there’s a re-issuance or repurchase of shares by the company.
Earnings per share (EPS)
As stated it is the net income available to common shareholders of the company divided by the number of shares outstanding. When evaluating a company, EPS often means if a company is making a profit or not, thus most investors would look at the EPS over the past few years to see if there’s any consistent growth.
Another data that an investor looking at the financial statement of a company is the Diluted earnings per share. It is the profit for a reporting period per share of common stock outstanding during that period. Diluted earnings per share are stated so that investors can determine how the earnings per share could be reduced if a variety of convertible instruments were to convert to stock. Thus, this measurement presents the worst case for earnings per share.
Dividend yield
The dividend yield is the ratio of dividend paid per share by a company to its current share price. Dividend yield measures the percentage return on a particular stock that has resulted from the company’s dividend payments.
Dividends are one of the two sources for return equity shareholders receive on their investment in a company’s stock while the other being the capital gains. A growth stocks might not pay any dividends resulting in a zero dividend yield, but it might be generating high capital gains for investors. On the other hand, a company in a mature industry may generate a decent dividend yield for its investors, but it may not have very high future growth potential.
Revenue Growth
Revenue Growth is one of the key metrics in accessing a company. Revenue growth gives a good picture of the rate at which companies have been able to expand their businesses. It gives investors an idea of how much a company’s revenue is increasing or decreasing over time.
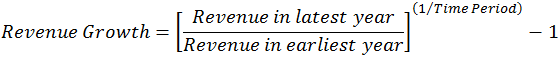
They are guidelines for what future growth could look like. Investors would look at a company’s historical growth rate, such as the 3-year Revenue growth or 5-year revenue growth, which show if a company is strong and growing and then forecast its future growth. Generally, stocks with higher revenue growth rates are generally more desirable than those with slower revenue growth rates.
Continue to Part 2 HERE